Xdebug is a PHP extension which provides debugging, tracing and profiling capabilities.
Installing xDebug in an Ubuntu based distribution is very easy using apt-get:
1
sudo apt-get install php5-xdebug
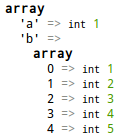
Just by installing xDebug you will get two very basic but useful rewards: Pretty var_dumps and pretty error messages.
So instead of getting this:
or this:
You will be getting this:
and this:
You can configure the dept of the variables nesting to show on your var_dumps with this xDebug property:
1
xdebug.var_display_max_depth
If after installing xDebug you are not getting this type of output you will have to add this line to your php.ini file:
1
html_errors = 1
One very useful xdebug directive that you can add to your php.ini file is xdebug.file_link_format, which print a link on your error messages that will open your text editor in the line where the error occurred. This is my configuration for Gedit:
1
xdebug.file_link_format = xdebug://%f@%l
Open Firefox and go to this URL:
1
about:config
Add a new boolean setting “network.protocol-handler.expose.xdebug” and set it to false.
Create a bash script with this content and make it executable.
1
2
3
4
5
6
#! /bin/sh

f=`echo $1 | cut -d @ -f 1 | sed 's/xdebug:\/\///'`
l=`echo $1 | cut -d @ -f 2`

gedit +$l $f
Next time you see a xDebug error and you click on a link you will see a pop up asking you to select a program to open that type of links. Choose the shell script you created.
It has happened to me that I have a web design that uses a lot of floats, absolute positions and z-indexes that whenever I get an error message it is impossible to read it because my layout hides the messages. For these occasions we can buffer the error messages and print them at the end of the layout using these functions:
1
2
3
xdebug_start_error_collection()
xdebug_stop_error_collection()
xdebug_get_collected_errors()
debugging php programming 


