Recently I have been exploring Android development and it was just a matter of time to find myself in the need to debug some of the code I write. Android documentation talks a little about debugging using Eclipse, but I try to stay away from bloated IDEs, so I have to pay by not getting the sugar they offer. The alternatives are not as easy and pretty as using an IDE with a compatible debugger, but hopefully they will do the job.
Logging
I come from PHP and JavaScript, so logging or dumping stuff is something that I am used to doing. When I started using JavaScript and I wanted to know what my code was doing or the value of a variable in a specific point in time I used console.log to print it to the browser terminal. Using this approach is really easy and very helpful in a lot of scenarios.
Android provides some functions to Log some information to help developers debug their applications. For debugging you will want to use Log.d, but there are other functions for logging errors(Log.e) or warnings(Log.w). The Log.d function signature looks like this:
1
public static int d (String tag, String msg)
or
1
public static int d (String tag, String msg, Throwable tr)
The tag string is usually a constant you define in your class to identify where this log comes from. The msg string can be any string you want to log. The tr argument is optional and can be a Throwable object from which a stack trace can be retrieved. An example of usage would be to add this to a click handler of a button:
1
2
// TAG is a constant defined somewhere in the current class
Log.d(TAG, "Hello World");
Now, we have a pretty log in our click handler. To actually be able to see our log we need to use logcat which is included with Adroid SDK. Just go to your android-sdk folder and do this:
1
2
cd platform-tools
./adb logcat
When you do this you will see a lot of output so you could use grep to see only debug logs with your specified tag:
1
./adb logcat | grep D\/SomeClass
The log output will look something like this:
1
D/SomeClass( 1161): Hello World
It is sometimes useful to keep the logcat window running without any filter while testing your application because it will show you useful information about errors and warnings your application runs into while executing.
JDB
JDB is a command line Java debugger that allows you to do most of the things graphical debuggers allow you to do, but has a steeper learning curve. To debug your application using JDB you first need to get the application id which you can do in two ways. You can use the adb command to get the ids of all the running applications in your emulator. To find out the id of your application start your emulator and do this:
1
2
cd android-sdk/platform-tools/
./adb jdwp
Which will give you a bunch of numbers in the output:
1
2
3
4
5
...
706
739
753
766
Now, start your app from the simulator (Click on your app icon) and run ./adb jdwp again, you will get a similar output, but now you know that the last number is your app id. The other way you can find the id of your app is using android debug monitor:
1
2
cd android-sdk/tools/
./monitor
This will open a window where you can find a list of all the applications running in your simulator. You can then look for your app and find the app id:
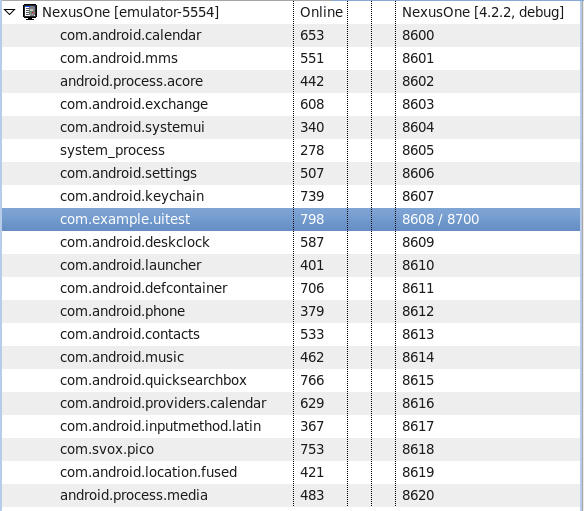
The next step is to forward android debugger for our app to a specific port so we can use JDB on that port:
1
2
cd android-sdk/platform-tools/
./adb forward tcp:7890 jdwp:798
Where 7890 can be any local port that is available and 798 is the previously discovered id. Now we just tell JDB to listen to the port we specified:
1
2
cd app-folder/
jdb -sourcepath src -attach localhost:7890
Now we have JDB running but since we don’t have any break points it is pretty much useless. While in the JDB prompt you can use the help command to get a list of commands you can use. I’ll describe some to get you started. The first thing you probably want to do is to set break points. You can do this easily using stop at or stop in.
1
2
> stop at com.example.uitest.UiTest:41
Set breakpoint com.example.uitest.UiTest:41
Here we set a break point in line 41 of our UiTest.java file in the project com.example.uitest. If you open your app and execute something that hits that line you will get this output:
1
2
3
4
Breakpoint hit: "thread=<1> main", com.example.uitest.UiTest.checkboxOneClicked(), line=41 bci=0
41          Log.d("SomeClass", "Hello World");

<1> main[1]
Your prompt changed because now you are debugging in the main thread. From here you can use eval (or print, they do the same) to inspect variables:
1
2
<1> main[1] print view
 view = "android.widget.CheckBox{40d01eb0 VFED..C. ...P..ID 10,10-212,58 #7f060000 app:id/checkbox_one}"
You can also use dump instead of eval to get much more detailed information about an object. From here you can move as in any other debugger using the following commands:
1
2
3
4
5
step - execute current line
step up - execute until the current method returns to its caller
stepi - execute current instruction
next - step one line (step OVER calls)
cont - continue execution from breakpoint
If you don’t want to specify the line number you can use use stop in to specify a method instead:
1
2
> stop in com.example.uitest.UiTest.checkboxOneClicked
Set breakpoint com.example.uitest.UiTest.checkboxOneClicked
From there everything works pretty much the same way.
android debugging java mobile programming