I have a digital ocean machine that runs a lonely server on it. This server is just a hobby project so I can afford it to go down every now and then. Nevertheless I want to minimize the time it goes down and be able to identify the cause when it happens.
My initial effort in this direction will be to setup some monitoring on the machine that runs my server. More specifically, I want to see the memory, network, disk, and CPU utilization of the machine graphed over time. This doesn’t solve all my problems but is a first step into getting more insight into what is happening in my server’s environment.
Graphite
From Graphite’s documentation:
Graphite is a highly scalable real-time graphing system. As a user, you write an application that collects numeric time-series data that you are interested in graphing, and send it to Graphite’s processing backend, carbon, which stores the data in Graphite’s specialized database. The data can then be visualized through graphite’s web interfaces.
From this description we can see 4 components that we need to be able to create the graphs we want. Here is what each of the components does:
- Collectd – Collect and submit data
- Carbon – Processes the data
- Whisper – Store the data
- Graphite-web – Graph the data
Before we start installing these tools, lets understand a little more about what they do.
Whisper
Whisper is the Database behind Graphite. It was built with the use-case of graphing time-series data in mind so it provides special functionality for this scenario.
In my opinion, there are two important things about Whisper you should know. The first one is that you can store information in different resolutions and for different time-frames. What this mean is that you can tell Whisper: I want to store 1 data point per second for one week, and that is exactly what Whisper will do. I also mentioned that you can save it in different resolutions, so you can do something like: I want to store 1 data point per second for one week and I also want to store 1 data point every 10 seconds for one month.
The other important aspect is that it is a fixed-size database. What this means for us is that the databases we need will be created upfront and they will be the same size all over their lifetime. In the previous example I mentioned that I wanted to store one data point per second for one week. Because there are 604800 seconds in one week, a database capable of storing 604800 entries will be created upfront. I also want to store 1 data point every 10 seconds and that would take 259200 entries. The database files are always the same size and work as a circular buffer to make reads faster.
Carbon
Carbon is a backend that will listen for data sent by other services. Its main task is to pass this data to Whisper as efficiently as possible.
The way it works is by listening for data in a variety of ways and then caching it in memory. This caching reliefs the system from constant disk writes so reads can be done more efficiently. After a certain threshold, Carbon will flush all the data from its cache to Whisper for long term storage and start over.
Installation
To make the installation easier to reproduce in the future (in case I want to setup more Graphite servers), I decided to use Docker. There is already a very popular Image for Graphite so I’m not going to attempt to create one from scratch. This image mentions Statsd, but I’m not going to talk about it in this post so you can just ignore it (I will cover it in another post). I will also assume you already have docker installed.
To start graphite from this image, use this command:
1
docker run -d --name graphite --restart=always -p 80:80 hopsoft/graphite-statsd
Graphite-web will run in port 80 inside the container. We are using the -p flag to expose the port 80 in the container as to port 80 in the host. You could use any port you want.
We have now a semi-working Graphite installation. You can see it by hitting the correct URL in the browser, for example: http://my.remote.server
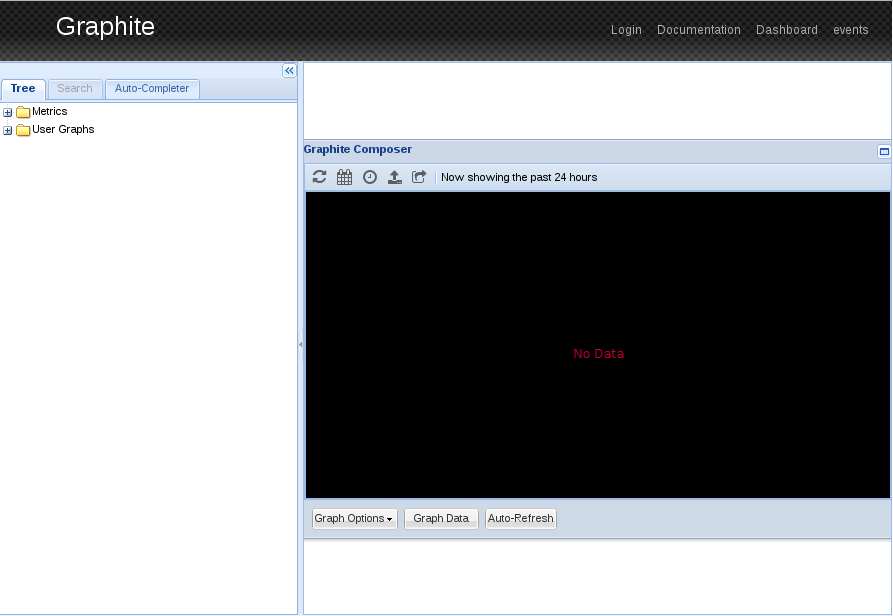
Now, I said semi-working, because we have no data. As a matter of fact we not only have no data, we have no way to send data to our server. Lets fix the problem of not having a way to send data. The only thing we need to do is open port 2003 which is where Carbon is running.
1
2
3
docker kill graphite
docker rm graphite
docker run -d --name graphite --restart=always -p 80:80 -p 2003:2003 hopsoft/graphite-statsd
And we can send some data to test that it is working (I’m using the GNU version of netcat for testing):
1
echo "test.graphite.count 20 `date +%s`" | nc my.remote.server 2003
After a few requests we can see something going on
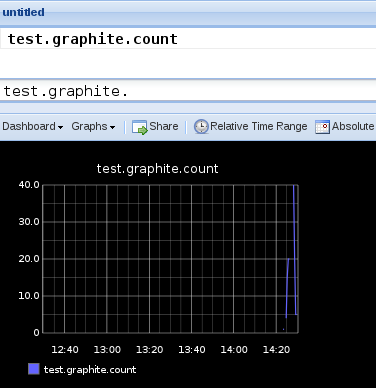 :
:
We got a very simple Graphite installed and tested very quickly. This is probably not a good configuration for production, but it is a good first step. The last thing we need to do is get Collectd up and running in the machine we want to monitor.
Collectd
Collectd is a Daemon that gathers statistics about the system where it is running and saves them to files or sends them to a server (In our case to Carbon). You can install it with this command in the server you want to monitor:
1
sudo apt-get install collectd
Next, you might want to set a hostname for that server. Edit /etc/collectd/collectd.conf and set the Hostname:
1
Hostname my-app-server-1
Now we need to tell Collectd what metrics to collect and where to send them. This is configured via plugins. You can open /etc/collectd/collectd.conf and look for the LoadPlugin section. I am particularly interested in these plugins:
1
2
3
4
5
6
LoadPlugin df # Disk
LoadPlugin cpu
LoadPlugin interface # Network
LoadPlugin memory
LoadPlugin swap
LoadPlugin write_graphite # Needed for writing to graphite
So I will comment all the others. Most of our plugins will work out of the box, but we need to configure write_graphite so it knows where to write. This should be added to collectd.conf:
1
2
3
4
5
6
7
8
9
10
11
12
<Plugin write_graphite>
    <Node "example">
        Host "my.remote.server"
        Port "2003"
        Protocol "tcp"
        LogSendErrors true
        Prefix "collectd."
        StoreRates true
        AlwaysAppendDS false
        EscapeCharacter "_"
    </Node>
</Plugin>
Restart Collectd and wait a few seconds. You should start seeing data in Graphite:
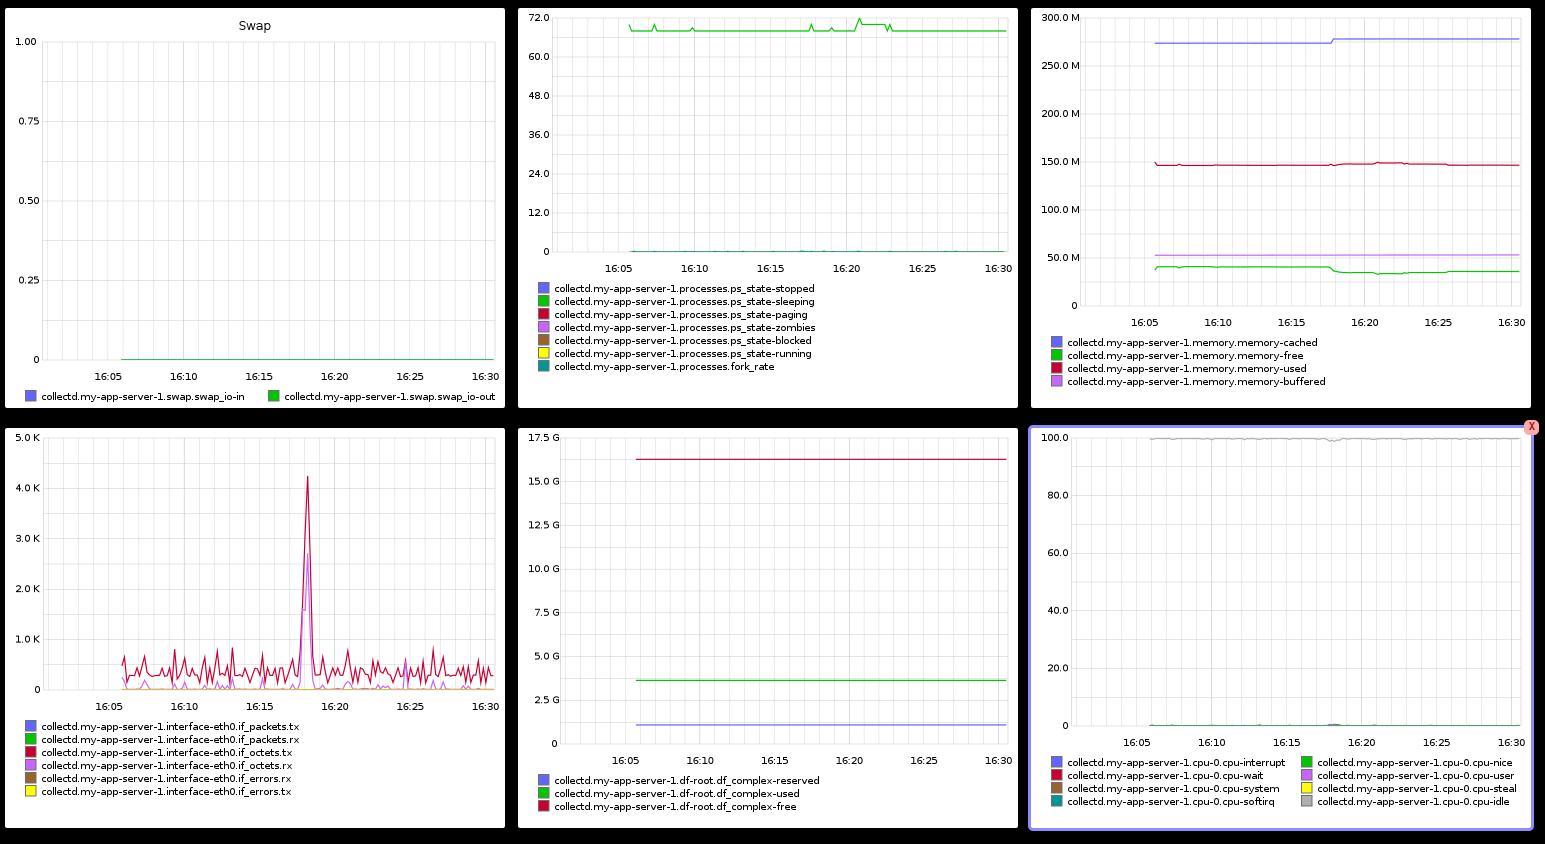
There is still a lot of work to do before this is production ready, but now we have a way of monitoring the state of our server.
docker linux