In a previous post I went over the basics of top. In this post I’m going over some more advanced features that can be used to diagnose problems.
Top will by default refresh every 3 seconds. If this is too often for you, you can specify how many seconds to wait between each refresh:
1
top -d 10
d stands for delay.
Another useful option is to hide idle tasks:
1
top -i
The letter i can also by used to toggle idle tasks while top is running.
If you are interested in processes belonging to a specific user:
1
top -u adrian
Or type the letter u while top is running. A prompt will appear to enter a user:
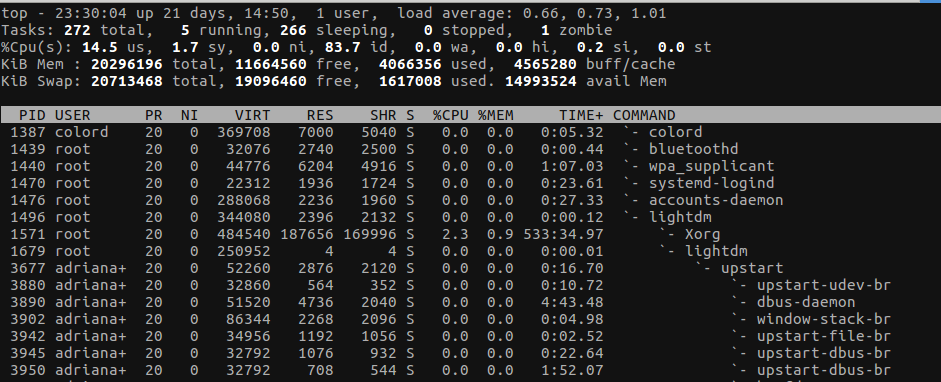
Another userful option is V. It can be used to see the processes as a tree (see which process is a child of which):
Sometimes besides seeing the processing running on your system you might want to kill them. You can use k to kill a process. You will be prompted for the PID and signal:
Working with columns
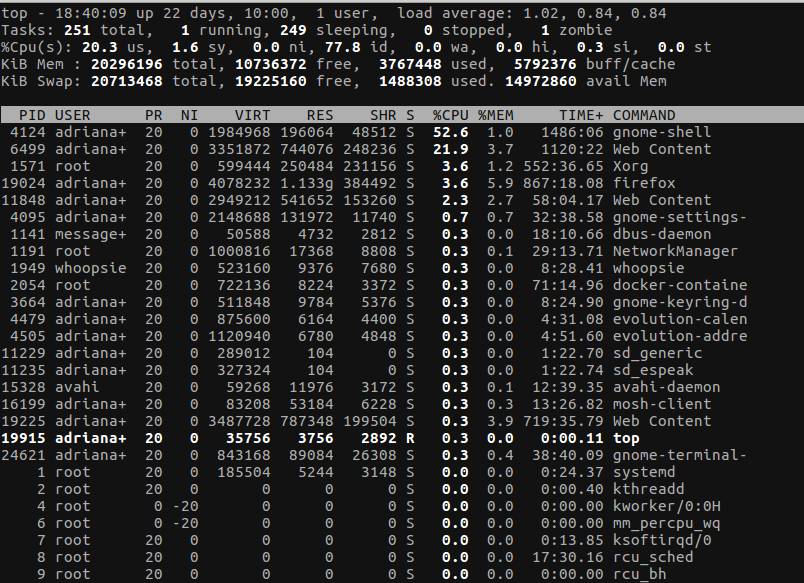
Another useful tool for finding what you are looking for is to work with the columns. While on top, use x to turn on column highlighting. This shows the currently selected column:
You can move between columns using < and > for left and right respectively. The task list will be sorted by the selected column. You can invert the sorting by using R. There are some bookmarks you can use to navigate between columns faster:
M- %MEMN- PIDP- %CPU
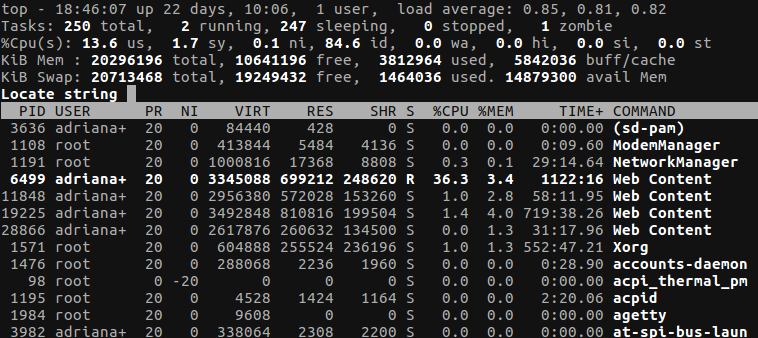
You can search for a string in the highlighted column using L:
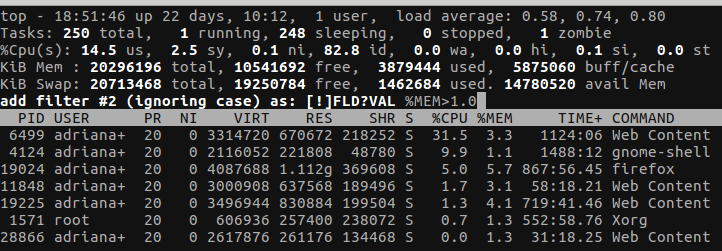
You can also filter the tasks based on a column. To start filtering enter o and enter a filter. An example filter can be: COMMAND=fire, which will only show commands containing the word fire. You can also find the processes using more than certain amount of memory: %MEM>1.0
This are the parts I found most interesting about top. If you know any trick I didn’t cover, please let me know.
debugging linux 


