You might be interested in these articles:
Envoy Tracing
In an Istio cluster, all applications are deployed with an Envoy proxy attached to them and Envoy supports integration with different tracing systems, this means, we can use Envoy’s features to automate tracing in our cluster.
This is what envoy can do for us:
- Initiate a trace when a request is received
- Propagate the trace-id over the cluster so spans can be connected
- Send information to tracing services like Jaeger
Installing Istio
Assuming we already have a Kubernetes cluster, we can use Istio’s installer for learning purposes (It is not intended to be used for production).
We can download the installer using:
1
curl -L https://istio.io/downloadIstio | sh -
The command creates a new folder (for example: istio-1.16.1) that contains istioctl, and the tools we need to experiment with it.
Add the bin folder to the system path:
1
export PATH=<path to istio folder>/bin:$PATH
Install Istio in our Kubernetes cluster:
1
istioctl install --set profile=demo -y
Configure Istio to automatically add side cars to our deployments:
1
kubectl label namespace default istio-injection=enabled
Running the demo app
In order to test that tracing is working, we will need some services running in our cluster. For this, we are going to install the Istio demo app:
1
kubectl apply -f istio-1.16.1/samples/bookinfo/platform/kube/bookinfo.yaml
Setup ingress gateway:
1
kubectl apply -f istio-1.16.1/samples/bookinfo/networking/bookinfo-gateway.yaml
Running Jaeger
Istio comes with a template that can be used to install all Jaeger components in our cluster:
1
kubectl apply -f istio-1.16.1/samples/addons/jaeger.yaml
Once jaeger is running we can open the UI with this command:
1
istioctl dashboard jaeger
Generating traces
Now it’s time to generate some traces. To do this we need to get the ip address of our ingress gateway:
1
kubectl get svc istio-ingressgateway -n istio-system
And make a request:
1
curl http://<External IP>/productpage
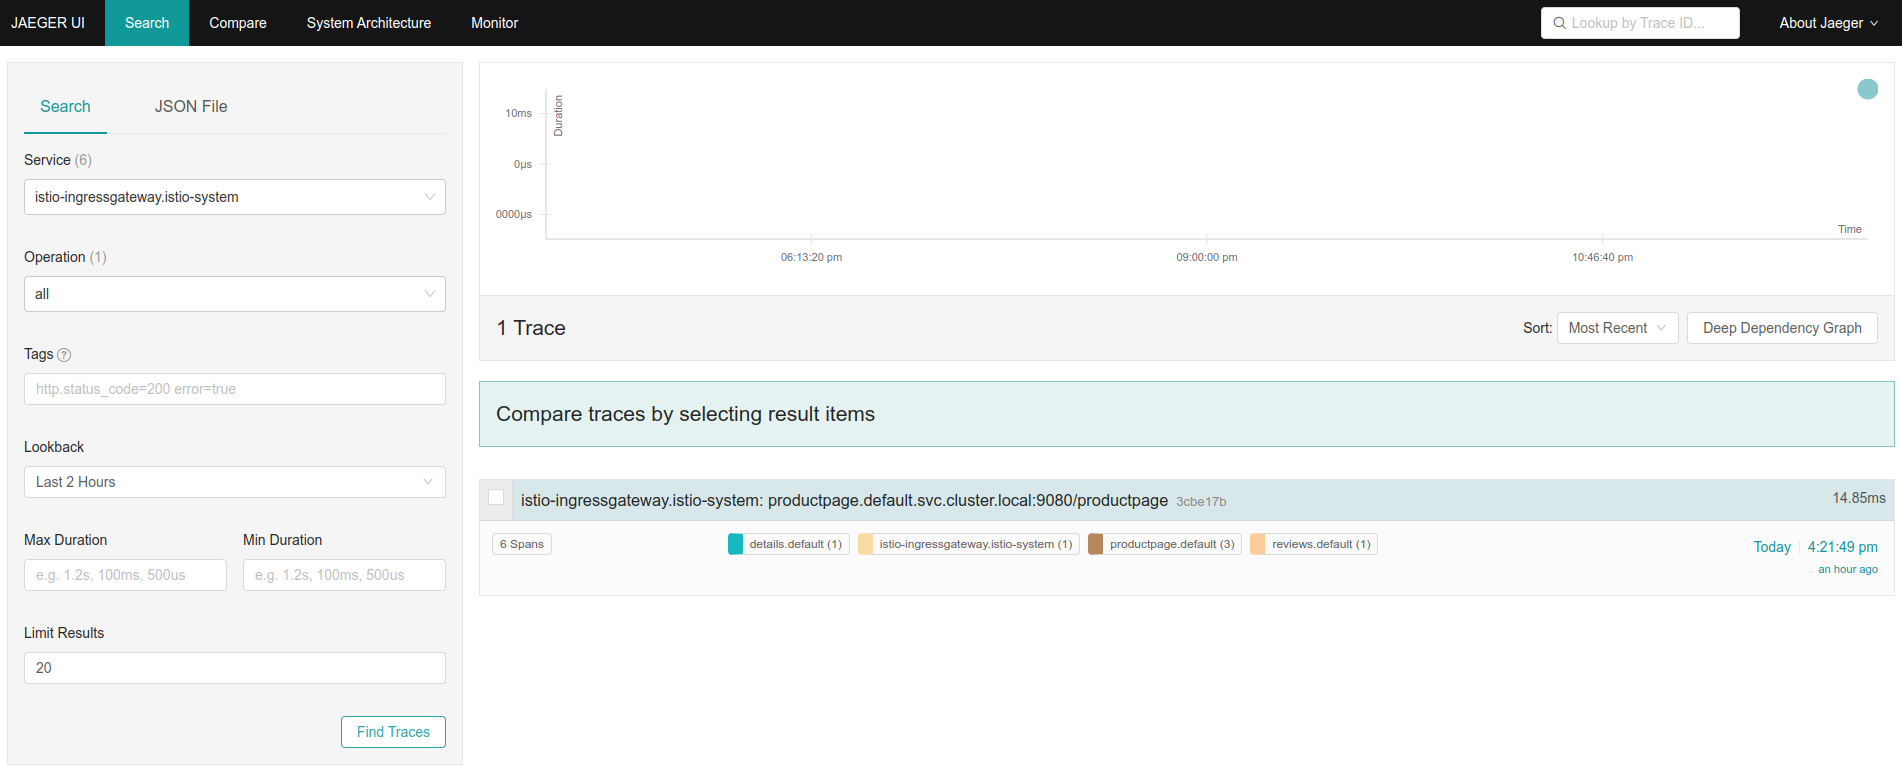
The request will now appear in Jaeger UI:
Sampling rate
Istio’s demo app is configured to send all requests to Jaeger. We can inspect the current sampling rate with this command:
1
kubectl -n istio-system describe deploy/istiod | grep PILOT_TRACE_SAMPLING
Enabling tracing for all requests in a production cluster is usually not a good idea. To edit the sampling rate, we can use:
1
kubectl -n istio-system edit deploy istio-pilot
If PILOT_TRACE_SAMPLING is set to 1, it means only 1% of requests will be traced.
Conclusion
In this article we learned how we can use Istio’s sidecars to easily enable tracing in our cluster.
If you want to try running the code yourself, take a look at Instrumenting an Istio cluster with Jaeger tracing.
architecture automation databases debugging docker networking