Jaeger is an Open Source tracing framework written in Golang. Jaeger is compatible with OpenTracing which is an open source standard that specifies how tracing data should be formed.
Tracing
Tracing is concept that became popular with the rise of microservices (Service Oriented Architecture). When we work with microservices, the number of requests going through our internal network increases very quickly. To do its job a service might have to call a lot of services and some of those services might need to call other services.
When we make so many network requests it’s sometimes hard to understand where a failure is coming from. Tracing keeps track of the dependencies between different services and allows us to visualize it in a easy to understand manner.
Tracing vocabulary
- Span - It describes a unit of work, for example, the execution of a request in a service. Should have at least an operation name, start time and duration
- Trace - A Directed Acyclic Graph of Spans. This is indirectly created when creating a parent span
Jaeger components
- Instrumentation SDKs - Libraries that know how to track tracing data and send it to Jaeger backends. Since Jaeger is compatible with OpenTelemetry, their libraries can be used
- Jaeger Agent - A daemon that receives spans from client libraries, batches them and sends them to the collector. An agent is not strictly necessary since the SDKs could talk directly with the collector
- Jaeger Collector - Receives traces, validates them and saves them to the selected storage backends
- Storage Backends - Database where the traces are stored. Supported storage backends are In-Memory, Cassandra, Elasticsearch, and Badger
- Jaeger Query - Retrieves traces from the Jaeger storage backend and makes them accessible to the Jaeger UI
- Jaeger UI - A web application that lets us visualize the traces
Running Jaeger
In a production environemnt it’s probably best to run all components separately. For learning purposes there is a Docker image we can use to start all components in one go:
1
2
3
4
5
6
7
8
9
10
11
12
docker run -d --name jaeger \
  -e COLLECTOR_ZIPKIN_HOST_PORT=:9411 \
  -p 5775:5775/udp \
  -p 6831:6831/udp \
  -p 6832:6832/udp \
  -p 5778:5778 \
  -p 16686:16686 \
  -p 14250:14250 \
  -p 14268:14268 \
  -p 14269:14269 \
  -p 9411:9411 \
  jaegertracing/all-in-one:1.30
Publishing to Jaeger is stlightly different depending on which SDK / Programming laguage we are using. This is an example of how to publish spans using Python:
1
2
3
4
5
6
7
8
9
10
11
12
13
14
15
16
17
18
19
20
21
22
23
24
25
26
27
28
29
30
31
32
33
34
35
36
37
38
39
40
41
42
43
44
45
46
47
48
49
50
51
52
import time
import threading
from opentelemetry import trace
from opentelemetry import context
from opentelemetry.exporter.jaeger.thrift import JaegerExporter
from opentelemetry.sdk.resources import SERVICE_NAME, Resource
from opentelemetry.sdk.trace import TracerProvider
from opentelemetry.sdk.trace.export import BatchSpanProcessor
from opentelemetry.trace import set_span_in_context


trace.set_tracer_provider(
   TracerProvider(
       resource=Resource.create({SERVICE_NAME: "my-service"})
   )
)

jaeger_exporter = JaegerExporter(
   agent_host_name="localhost",
    agent_port=6831,
)

trace.get_tracer_provider().add_span_processor(
    BatchSpanProcessor(jaeger_exporter)
)

def start_span(tracer, context, name):
    with tracer.start_as_current_span(name, context):
        print(f"{name} span")
        time.sleep(1)

tracer = trace.get_tracer(__name__)
with tracer.start_as_current_span("first-span"):
    print("first span")

    # Start execution in new thread
    ctx = context.get_current()
    t1 = threading.Thread(target=start_span, args=(tracer, ctx, "second"))
    t1.start()

    # Start execution in another thread after 1 second
    time.sleep(1)
    t2 = threading.Thread(target=start_span, args=(tracer, ctx, "third"))
    t2.start()

    with tracer.start_as_current_span("fourth"):
        print("fourth span")
        time.sleep(1)

    time.sleep(1)
    t1.join()
    t2.join()
The example above publishes 4 spans:
- first-span - The parent of all our spans
- second-span - Executes as a child of
first-spanin a new thread - third-span - Executes as a child of
first-spanin a new thread afterfirst-spansleeps for one second - fourth-span - Executes as a child of
first-spanin parallel withthird-span
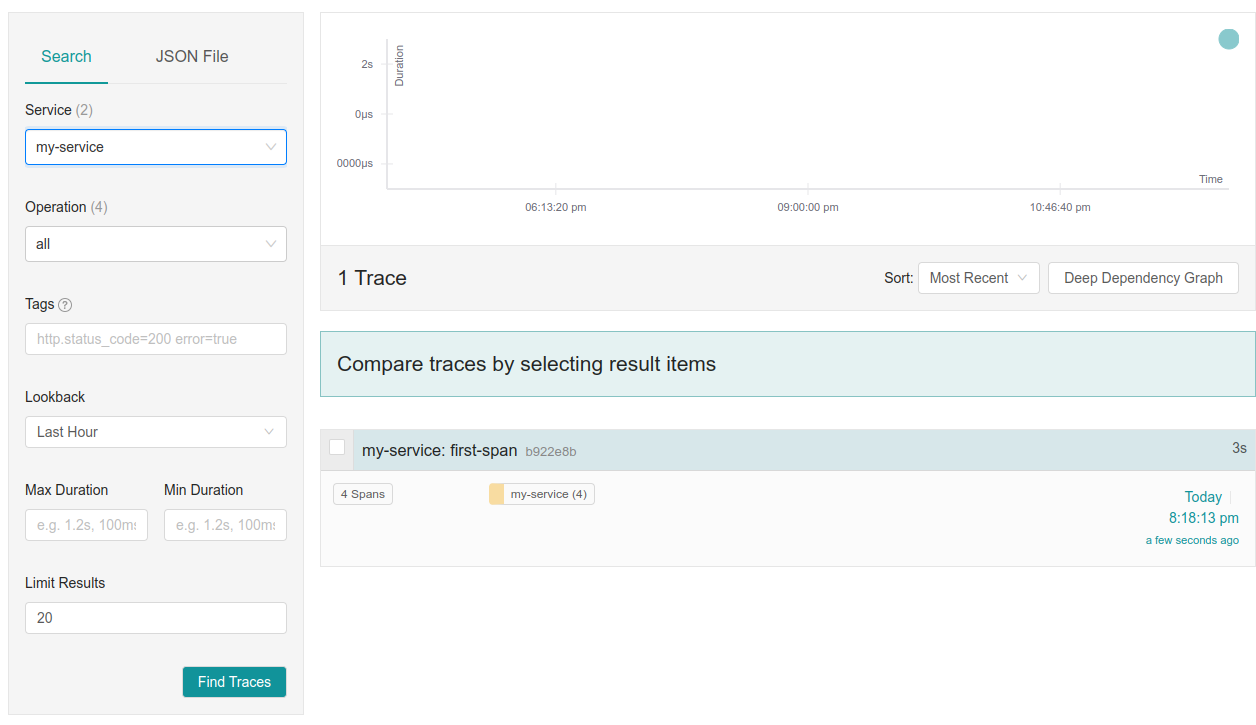
We can see the relationships between these spans and the time it took for them to execute in the Jaeger UI at http://localhost:16686/. We can search for the traces for my-service:
And click on the trace titled my-service: first-span:
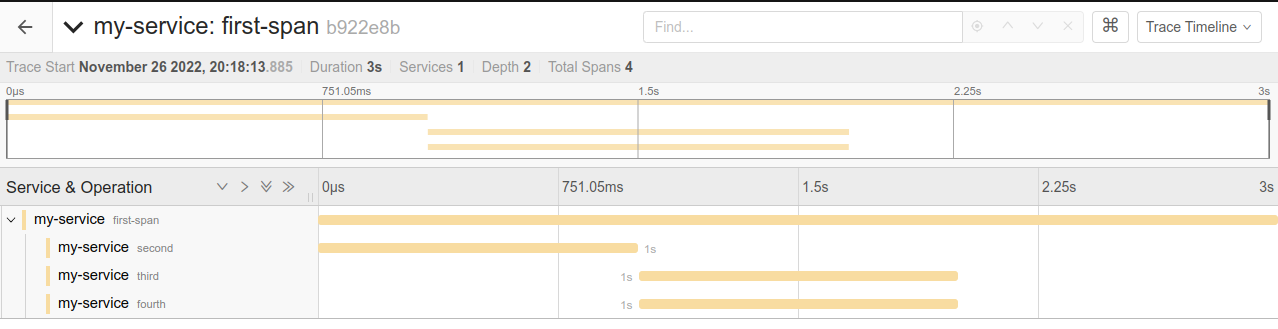
The UI allows us to see the which spans are children of other spans and which ones executed in parallel.
Conclusion
In this article we learned how to run Jaeger, use the Python SDK to publish some spans and how to visualize those spans in the UI.
Tracing becomes more interesting when spans are created and augmented from different services.
We can find the complete runnable example in Introduction to Jaeger Tracing.
architecture automation databases debugging networking